> ## Documentation Index
> Fetch the complete documentation index at: https://docs.guidelypro.ai/llms.txt
> Use this file to discover all available pages before exploring further.
# Metrics
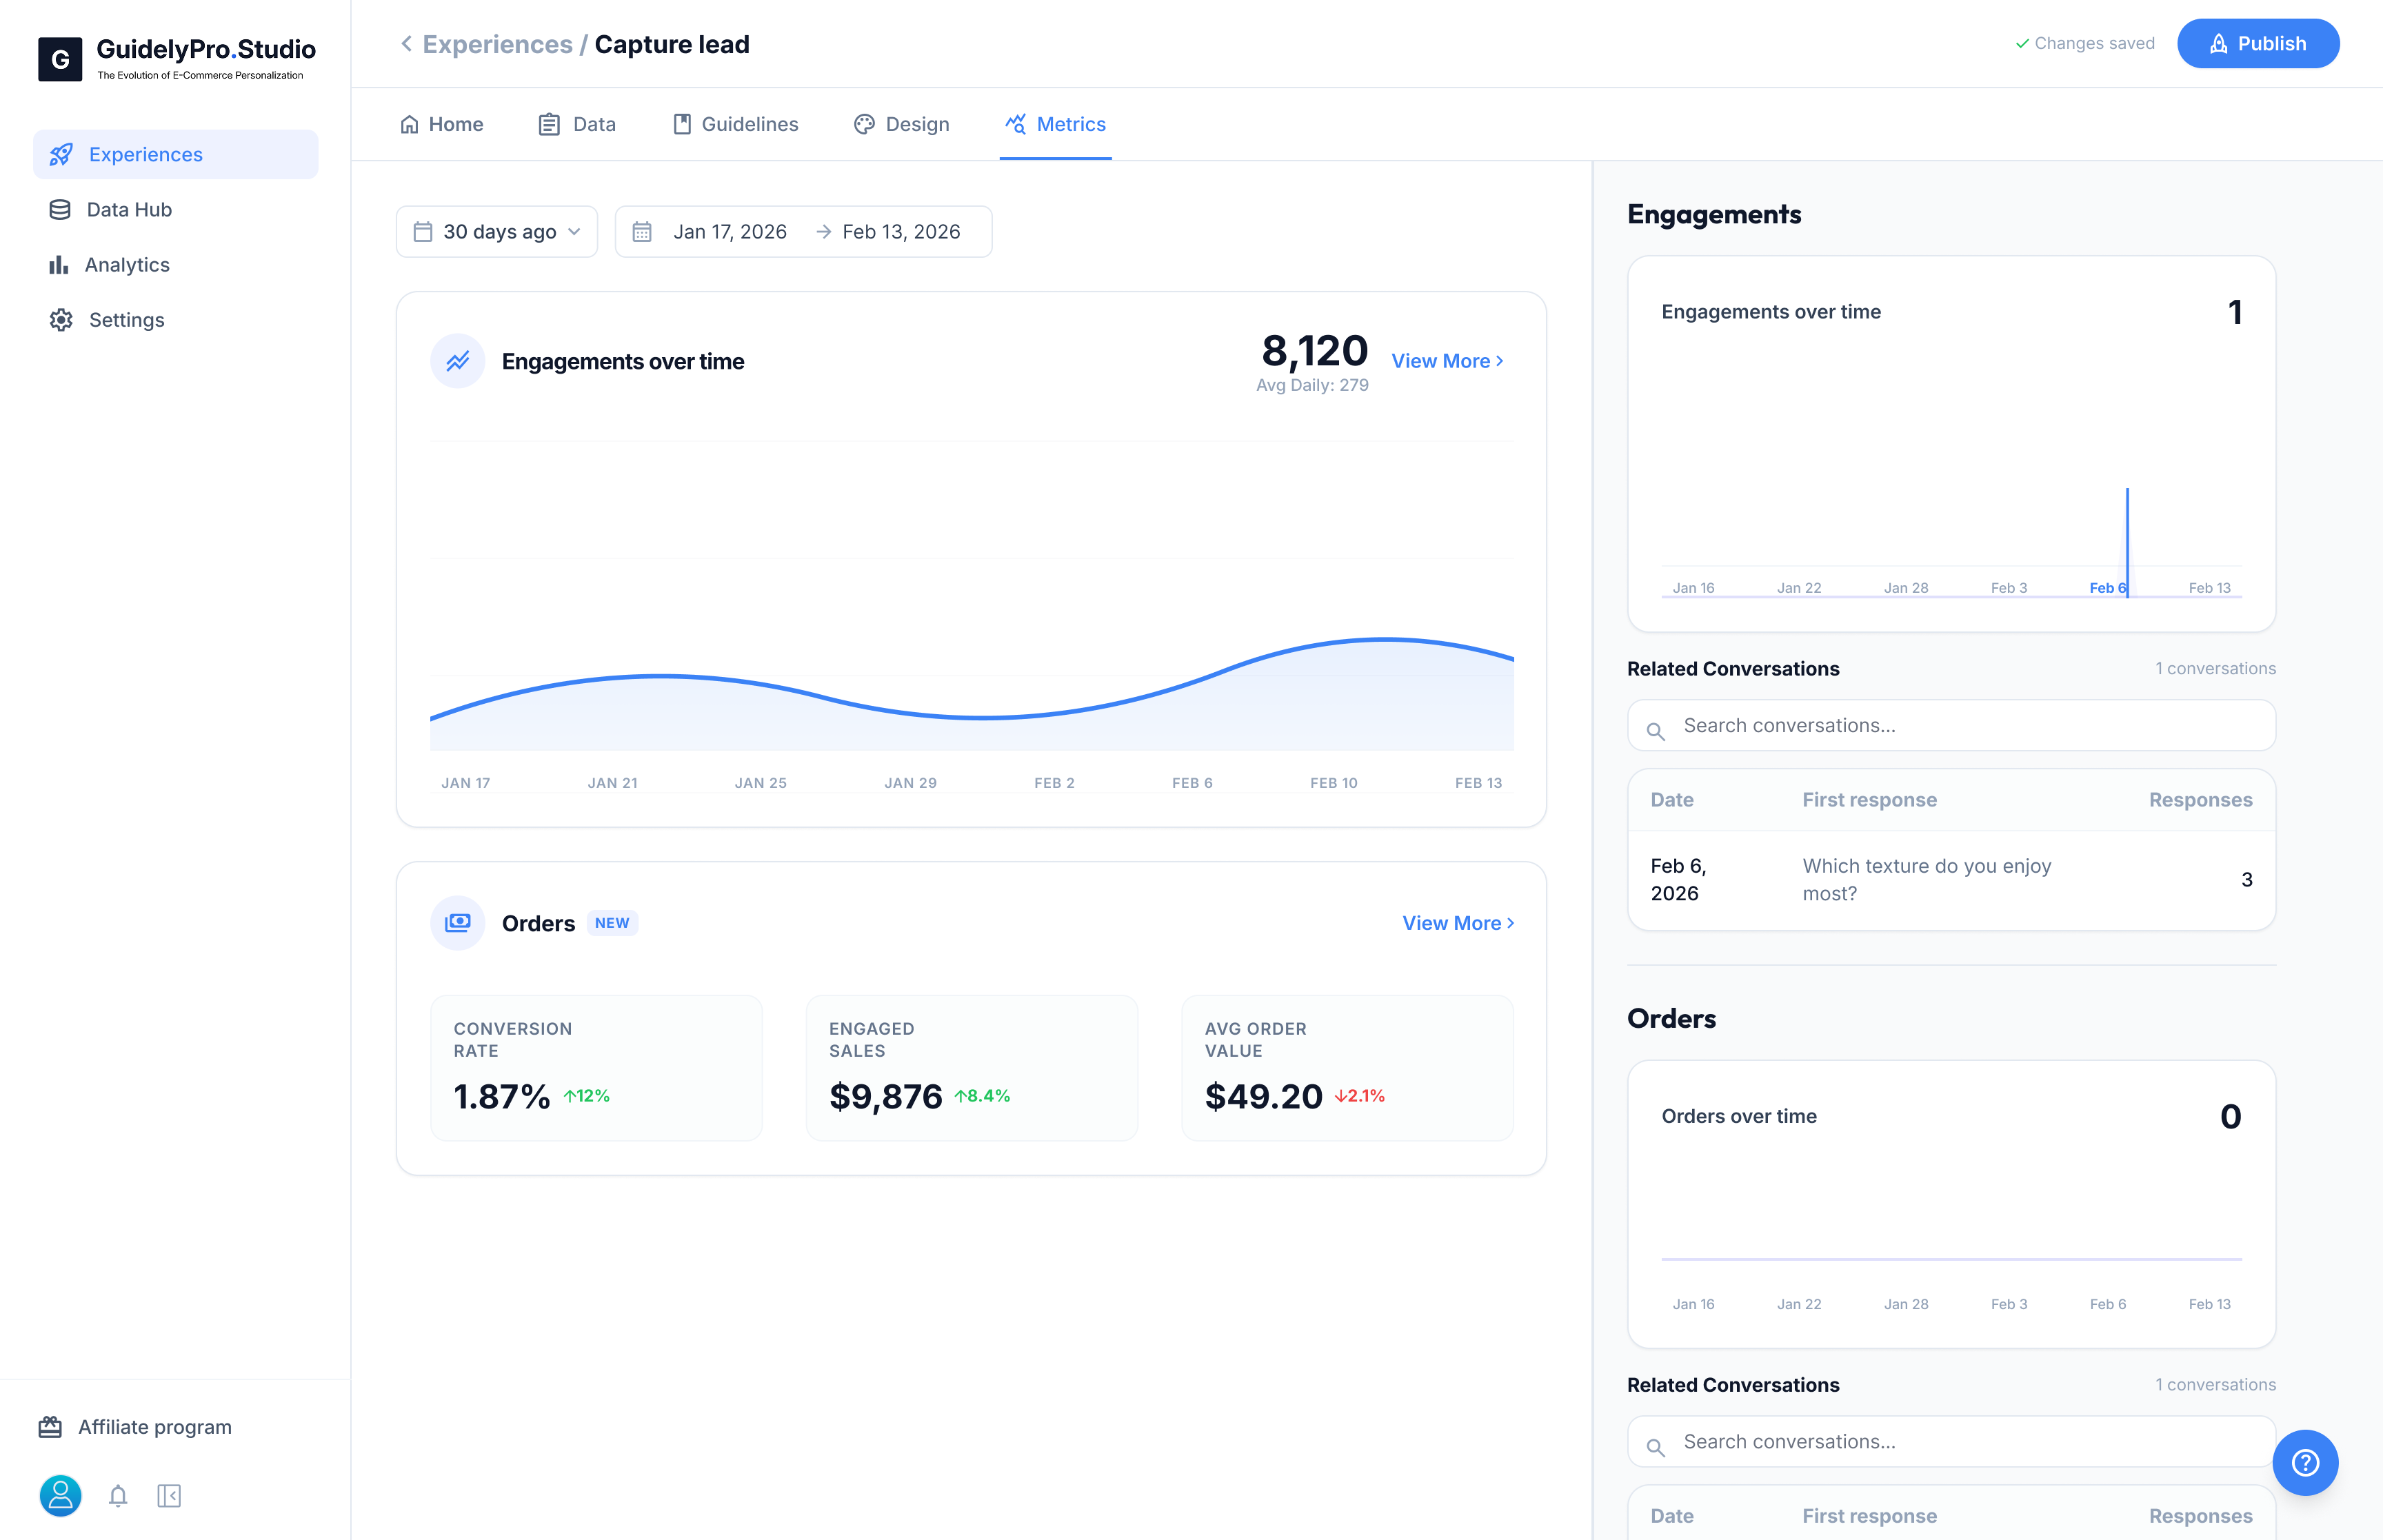
The **Metrics** tab shows how your Experience is performing.
This is where you track engagement, conversions, and revenue impact over time.
 ***
### 📈 Engagements Over Time
This chart shows how many visitors interacted with your Experience during the selected date range.
You can:
* Adjust the time filter
* View total engagements
* See average daily interactions
This helps you understand traffic and usage trends.
***
### 🛒 Orders & Revenue
The Orders section connects engagement to business results.
Key metrics include:
* **Conversion Rate** – Percentage of engaged users who completed a purchase
* **Engaged Sales** – Revenue generated after interaction
* **Average Order Value (AOV)** – Average purchase value from engaged users
These metrics help measure AI-influenced performance.
***
### 💬 Related Conversations
You can review actual conversations tied to engagements or orders.
This allows you to:
* Analyze user behavior
* Identify drop-off points
* Improve question flow
* Optimize recommendations
***
The **Metrics tab** turns conversations into measurable performance data, helping you continuously improve conversion and revenue impact.
***
### 📈 Engagements Over Time
This chart shows how many visitors interacted with your Experience during the selected date range.
You can:
* Adjust the time filter
* View total engagements
* See average daily interactions
This helps you understand traffic and usage trends.
***
### 🛒 Orders & Revenue
The Orders section connects engagement to business results.
Key metrics include:
* **Conversion Rate** – Percentage of engaged users who completed a purchase
* **Engaged Sales** – Revenue generated after interaction
* **Average Order Value (AOV)** – Average purchase value from engaged users
These metrics help measure AI-influenced performance.
***
### 💬 Related Conversations
You can review actual conversations tied to engagements or orders.
This allows you to:
* Analyze user behavior
* Identify drop-off points
* Improve question flow
* Optimize recommendations
***
The **Metrics tab** turns conversations into measurable performance data, helping you continuously improve conversion and revenue impact.